Revenue trend, traffic, and popular items
The dashboard charts showing your revenue over the last 6 months, where visitors come from, and what customers rent most.
Where to find it
Dashboard → Revenue, Traffic, and Popular Items widgets
These widgets show how your business is doing beyond today: money coming in, where your website traffic comes from, and which rentals customers pick most.
Where to find it
Look among your dashboard's widgets for the charts and lists covering revenue, traffic, and popularity.
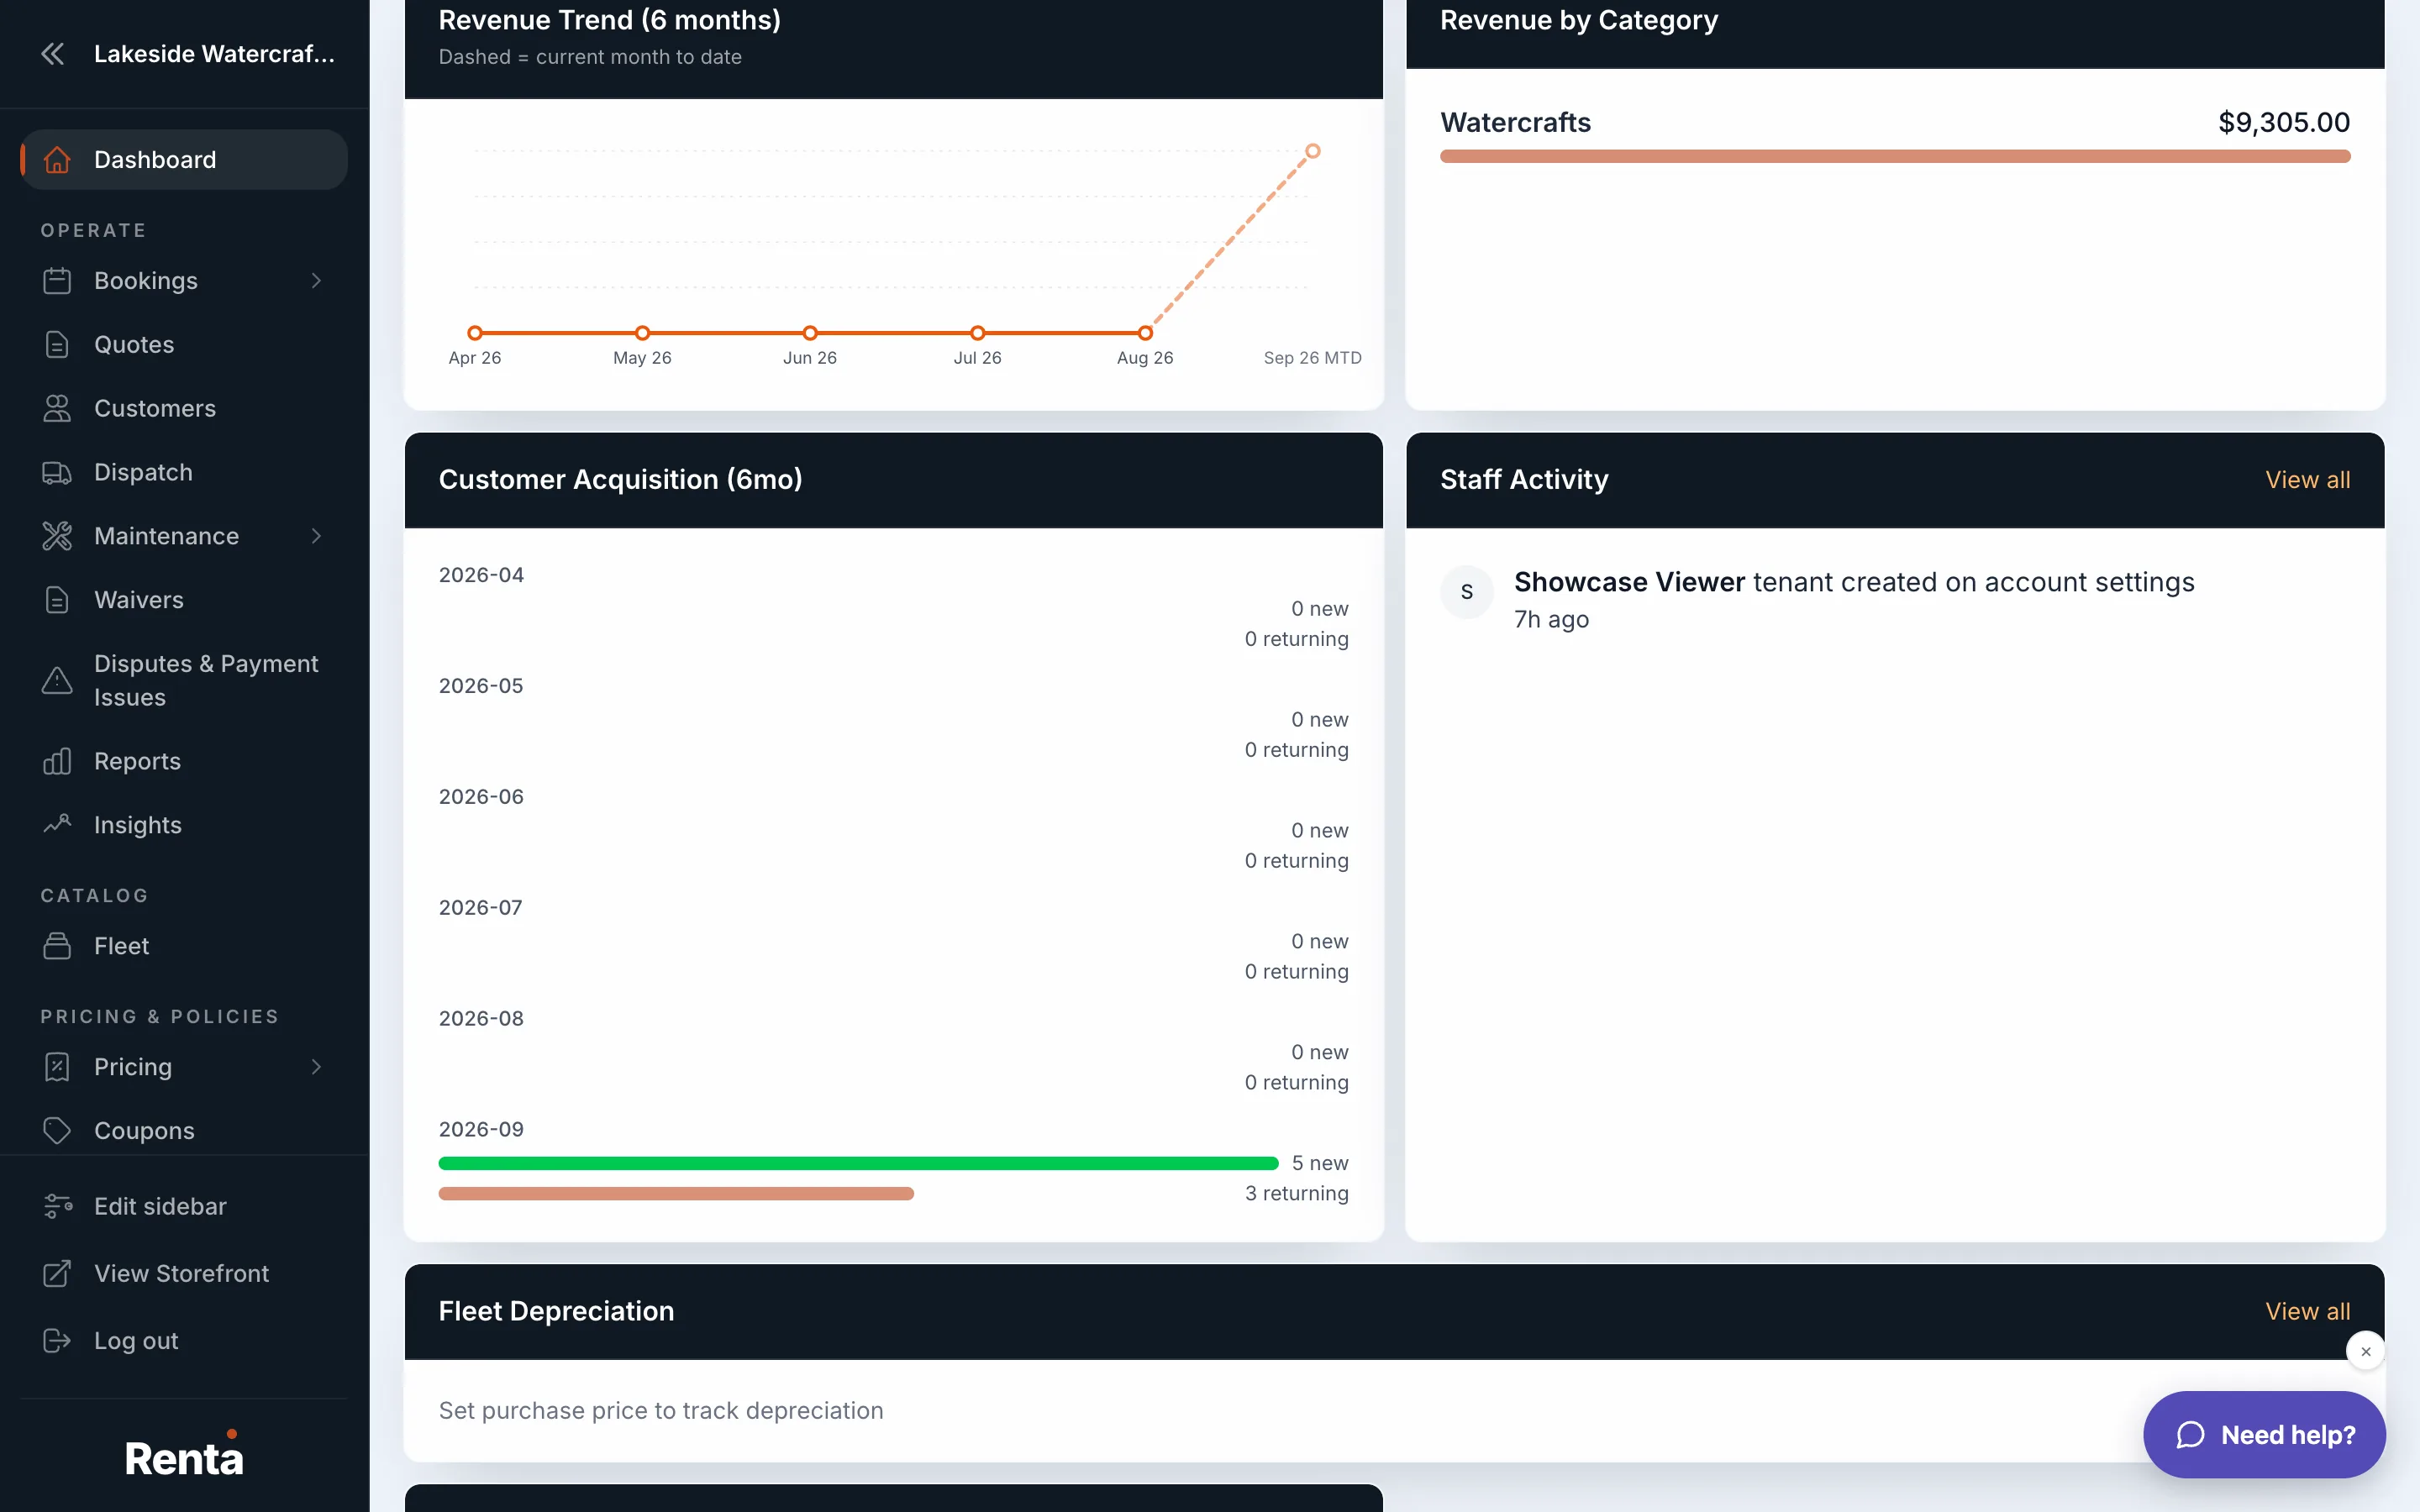 The Revenue Trend chart and Popular Items list
How it works
- Revenue Trend (6 months) — a monthly chart of your revenue over the last 6 months. The current month is shown as a dashed segment, since it's still in progress (month-to-date), not a finished month yet
- Revenue by Category — a bar chart splitting this month's rental revenue by fleet category (e.g. kayaks vs. jet skis)
- Traffic Overview — how many people are visiting your public booking website
- Customer Acquisition — a line chart of new customers added this month
- Popular Items — your top 5–10 most-rented items this month, with photo, name, and rental count
- Fleet Depreciation — see Fleet health and maintenance snapshot
- Staff Activity — a log of staff logins and actions
For example: if the Popular Items widget shows your tandem kayak has been rented 30 times this month while a single kayak was rented twice, that's a signal to add more tandem kayaks to your fleet.
Good to know
- The dashed line on Revenue Trend just means the current month isn't finished yet — don't read it as a drop in revenue.
- For the reportable, filterable version of these same figures (with a custom date range), see Revenue, popular items, and repeat customers.
- Traffic and search-specific detail lives separately — see How many people are visiting your site.
Related
Still stuck? Ask the chat.