How a unit's value depreciates over time
Track a unit's purchase price, current value, and how its value declines as it's used.
Where to find it
Fleet → open an item → Details → a unit → Asset Editor
For a unit tracked individually, Renta can record what you paid for it and calculate how its value has declined as it's been used, based on the meter that makes sense for that item.
Where to find it
Fleet → open an item → Details → a unit → Asset Editor section (collapsible).
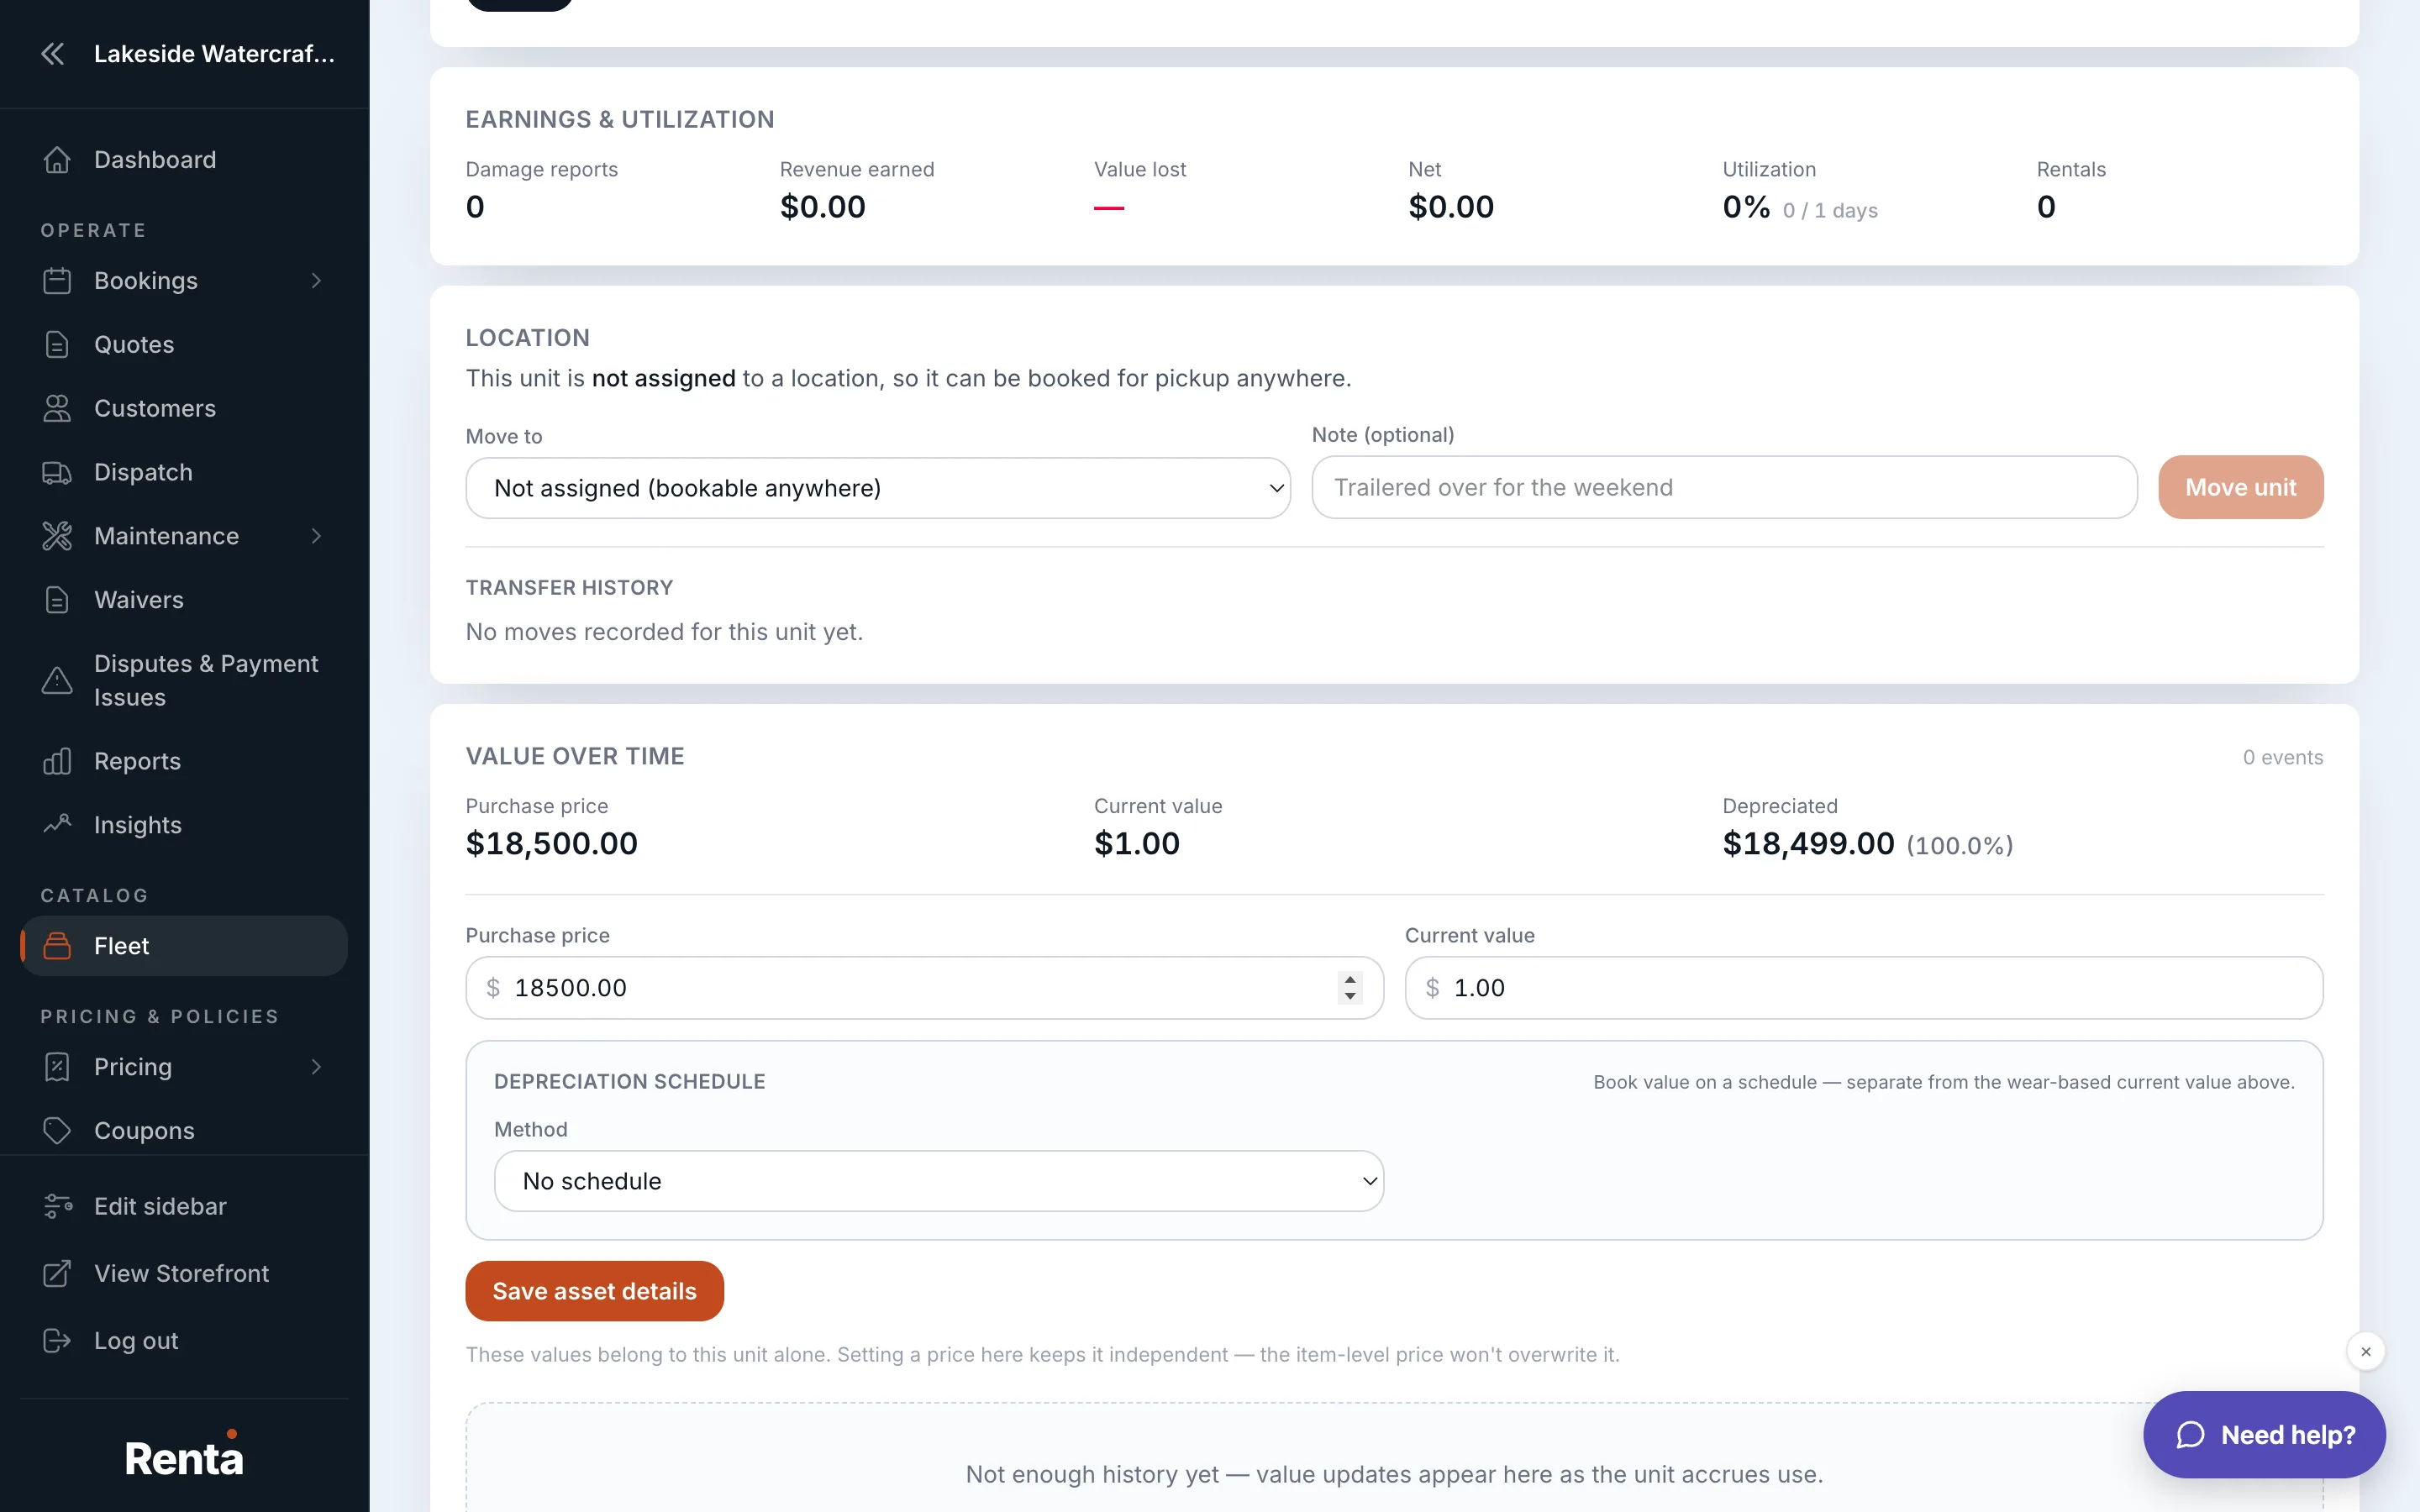 Asset Editor with the Value Over Time chart
How it works
- Purchase Price — what you originally paid for this specific unit. Not set by default.
- Current Value — calculated automatically from the purchase price and every depreciation event logged so far. Read-only.
- Depreciation Rate — how fast the value declines, shown per hour, mile, day, or rental, depending on how the item's maintenance schedules are configured to track usage. Available meters are Hours, Miles, Utilization Days, and Rental Uses.
- Value Over Time Chart — a line graph plotting current value against the meter that's tracking it.
- Depreciation Logs — a running history of every depreciation event, automatic or manually logged, with timestamp, meter type, and how much the meter and value changed.
Example
A jet ski bought for $8,000 with a per-hour depreciation rate loses value each time its engine hours increase from rentals — the Value Over Time chart shows that decline as a line moving down as hours accumulate.
Good to know
- Which meter applies depends on the item's maintenance schedules — see Maintenance schedules on one item.
- To see your whole fleet's asset value at once instead of one unit at a time, see Your whole fleet's asset value.
Related
Still stuck? Ask the chat.